
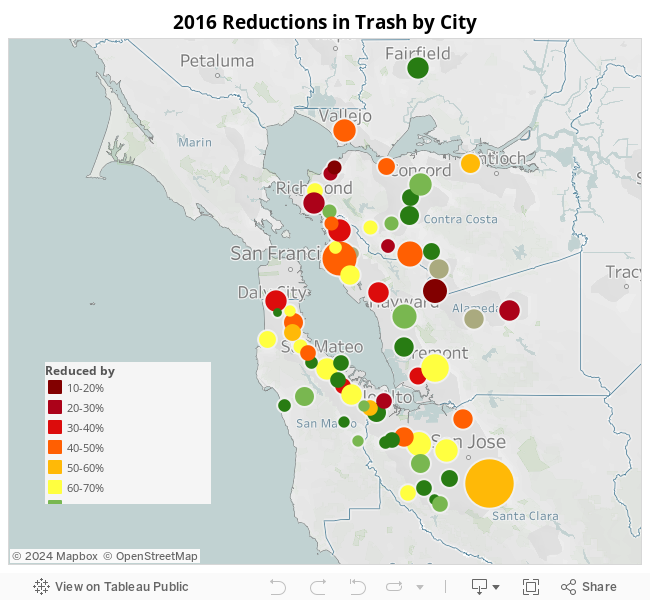
The size of the dots above correspond to the relative population of each city. Cities highlighted in green have already achieved the 70% trash reduction required by July 2017, while the cities highlighted in yellow, orange, and red are falling short of this milestone. Take time to hover over the map to see how much your city has reduced its trash problem.
The State of Trash in 2016: Mapping Bay Area Progress in Reducing Trash in Our Creeks Trash flowing through stormwater systems and into the Bay is one of the most visible environmental problems plaguing the Bay Area. The abundance of trash drifting along our waterways spoils local shorelines, harms wildlife, and makes its way out to already polluted oceans. This is why, in 2010, the San Francisco Bay Regional Water Quality Control Board ordered 78 Bay Area cities and agencies to eliminate trash from their stormwater systems by July 1, 2022. They must also demonstrate progress toward this goal with a 70 percent reduction in trash from 2009 levels by July of this year, and an 80 percent reduction by July 2019. Last year, we wrote about how this trash reduction effort is progressing, and we are back this year to give you an update on progress made in 2016. As you can see from the maps above, there has been both progress and setbacks throughout the region. Comparing the 2015 and 2016 trash reduction maps, we see the largest improvements in a handful of communities including San Mateo, Santa Clara, and Contra Costa County, while little to no progress has occurred in many larger and resource-strapped cities, like those bordering the Bay in the East Bay. This regional inconsistency is concerning because cities with the worst trash problems often have the fewest resources to cope with them. This is why Save The Bay is calling upon state and local elected officials to secure funding for reducing trash in our cities and the Bay. Many Cities Lack Resources and Are Falling Behind In 2016, cities were asked to demonstrate a 60 percent reduction from 2009 levels in the amount of trash flowing from urban areas into storm drains. Unfortunately, out of the 78 Bay Area communities and agencies covered by the Regional Water Board’s trash requirements, 26 were not in compliance with the 2016 target. These 26 cities are now in danger of not achieving the 70 percent reduction in trash required by this July. To help these cities move forward, the Regional Water Board required each of them to put forward a plan to reach 70 percent. The plans vary from highly-detailed, multi-page reports like those submitted by the cities of Berkeley and Pittsburg, to brief outlines that barely address funding and implementation, like those submitted by Vallejo and Contra Costa County (covering the county’s unincorporated communities) . Residents of the 26 out-of-compliance municipalities should be concerned about the lack of progress, not only from an environmental standpoint, but also from a legal one. Failure to reduce trash according to the Regional Water Board’s timeline could open cities up to costly penalties or even third-party lawsuits. This is why it is so important to implement effective strategies to reduce trash immediately. Reducing Trash: What Works? One of the most common strategies cities use to reduce stormwater trash is the installation of trash-capturing devices in key spots. Examples of these devices range from relatively small screens placed inside storm drains to giant, underground tanks that trap a large volume of trash while allowing water to flow through. Beyond trash-capture devices, street sweeping, neighborhood clean-ups, illegal dumping abatement programs, and providing more public trash bins are other popular approaches municipalities can take to reduce stormwater trash. The Regional Water Board also endorses bans on plastic bags and Styrofoam, and many Bay Area cities have adopted one or both as part of their trash-reduction strategy. Finally, although stopping trash before it reaches a creek is best option, the Regional Water Board encourages and offers incentives for creek and shoreline cleanups to reduce the negative impacts of the trash that does make its way into the watershed. Despite the wide variety of potential trash-reduction strategies, cities face many significant obstacles. These include widespread illegal dumping, insufficient state and local funding, difficulties accurately measuring trash in stormwater systems, and the large amount of trash that flows from areas that cities don’t control, such as highways and private property. Taking A Closer Look Here’s a more detailed look at five very different Bay Area cities and the progress each has made in reducing trash in their communities. Hover over each of our digital maps to view the current (blue) or planned (green) locations of trash capturing devices throughout each city.


Where We Go From Here Although we have seen areas of significant progress in reducing stormwater trash since the Water Board implemented its zero trash requirement, it is clear from the maps above that the Bay Area still has a long way to go. Save The Bay will continue to work with local communities and the Regional Water Board to ensure 100 percent stormwater trash reduction is achieved by 2022, but we need your help. Take time to organize or volunteer for neighborhood cleanups, urge your local officials to prioritize stormwater projects, and stay tuned for other opportunities to take action.